
Solar Energy - Science Fair Log
| October 5, 2015 | Worked on research paper, found five reliable sources. To access those sources the researcher can go to the following web sites: * http://www.livescience.com/41995-how-do-solar-panels-work.html * https://joinmosaic.com/how-do-solar-panels-work * http://education.nationalgeographic.com/encyclopedia/solar-energy/ |
|
| October 8, 2015 | Made eight total index cards about Solar Panels and how they work from source number one. (http://www.livescience.com/41995-how-do-solar-panels-work.html ) | |
| October 14, 2015 | Completed a total of fifty index cards made for research paper. | |
| October 20, 2015 | Made Working Outline for research paper. | |
| October 29, 2015 | The hypothesis was constructed: It is hypothesized that the amount of energy collected by a solar panel will increase when the solar array is arranged similar to leaves on a tree rather than a flat surface or an angled roof of a house. To test the hypothesis, a miniature replica of a house with a flat roof and solar panels will be constructed. Along with that, a replica of a house with an angled roof and a miniature tree configuration will also be made. All three replicas will have the same size and amount of solar panels and be measured at the same time of each day. |
|
| November 6, 2015 | Began developing the research paper. Took notes to research more on Nuclear Fusion. | |
| November 12, 2015 | Submitted paper containing the topic, hypothesis, and the variables for the science fair topic. | |
| November 15, 2015 | Packages containing materials needed for the experiment with solar panels and a multimeter has arrived. Continued to work on research paper. 10 November 2015. http://www.famousscientists.org/alessandro-volta/ Dhar, Michael. “How Solar Panels Work.” Live Science. Parch. 2015. 5 October 2015. http://www.livescience.com/41995-how-do-solar-panels-work.html “Electron.” Dictionary.com. Dictionary.com. 2015. 5 October 2015. http://dictionary.reference.com/ “How Do Solar Panels Work?” Mosaic. Mosaic. 2015. 5 October 2015. https://joinmosaic.com/how-do-solar-panels-work “Nuclear Fusion.” Cora.Nra. Cora.Nra. 2015. 10 November 2015. https://www.cora.nwra.com/~werne/eos/text/fusion.html “Photon.” Dictionary.com. Dictionary.com. 2015. 5 October 2015. http://dictionary.reference.com/ “Quiz: Test Your Solar IQ.” U.S. Department Of Energy. Energy.gov. 2015. 5 October 2015. http://www.energy.gov/articles/quiz-test-your-solar-iq “Solar Panel.” Dictionary.com. Dictionary.com. 2015. 5 October 2015. http://dictionary.reference.com/ “Solar Panel Brief History and Overview.” Energy Matters. EnergyMatters.com. 2015-2016. 10 November 2015. “Types of Solar Panels.” Pure Energies. NRG Home Solar. 2014. 10 November 2015. http://pureenergies.com/us/how-solar-works/types-of-solar-panels/ |
|
| November 18, 2015 | Completed 1st draft of research paper. | |
| November 30, 2015 | Completed second draft of research paper. | |
| December 10, 2015 | Purchased the following items to construct the three models:
|
|
| December 15, 2015 | Sawed off the top of one of the bird houses and sanded down edges. The house is now ready for a flat piece of wood to be glued to the top. This will form a flat roof. | |
| December 16, 2015 | Used wood glue to glue two bird houses together to form the replica of the house with the angled roof. Glued a flat piece of wood to the top of the other sanded house to form the house with the flat roof. |
|
| December 17, 2015 | Went outside and found a fallen branch for tree configuration. Approximate size 35 cm. | |
| December 18, 25015 | Glued 14cm x 13cm flat board and 14cm x 10cm flat board together to form base for tree configuration. Drilled a hole in the center of the base, and glued branch in the hole of the wooden base boards. | |
| December 19, 2015 | Tested each of the 18 individual solar panels in the sunlight using the multimeter to ensure the solar panels were working properly. | |
| December 20, 2015 | Attached six solar panels to each configuration:
|
|
| December 21, 2015 | Researched how to wire solar panels. One option is to wire them is in series. This means to connect all the wires positive to negative. Hooking up solar panels in series increases the voltage.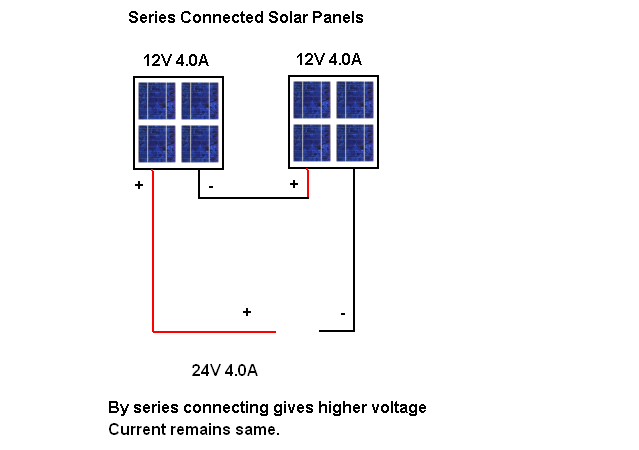 Another option is to wire a solar panel is in parallel. This means to connect all the wires positive to positive and negative to negative to increase the amperage. Decided to connect panels in parallel. 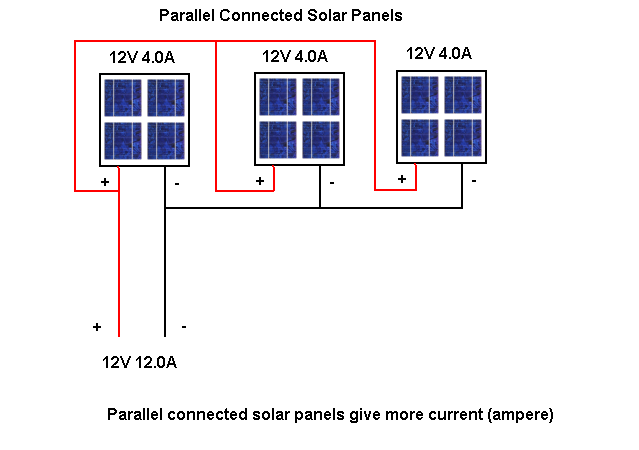 (Source: http://www.solar-facts.com/panels/panel-wiring.php) |
|
| December 22, 2015 | Connected solar panels in parallel by connecting all the positive wires together and all the negative wires together. | |
| December 31, 2015 | Tested each of the solar panel configurations to ensure they were functioning properly. The test was successful. Experiment will begin tomorrow and last for 12 days. | |
| January 1, 2016 | Set up Excel Spreadsheet with columns for recording Date, Time, Amps, Volts, Weather Conditions, Temperature for each trial. | |
| January 2, 2016 | Began testing of Daily Output. Placed models with the three different solar configurations in sunlight on table and marked location of each model on the table with duct tape to ensure the same location for all trials. Used multimeter to determine Amps and Volts of each configuration and recorded in spreadsheet. Recorded Amps and Volts for each configuration at 8am, 12pm, and 4pm. Results showed that the tree configuration had the highest energy output in both volts and amps. | |
| January 3, 2016 | Continued experiment in same manner as before, testing at 8am, 12pm, and 4pm. Received similar results as previous day. | |
| January 4, 2016 | Discovered a mistake in the results of data from January 2-3, 2015 trials after doing additional research on circuits. The Amps and Volts were measured in open and short circuit during the previous trials. When measuring the Volts in this manner, the Amps are zero. When measuring the Amps in this manner, the Volts are zero. Since Watts= Amps * Volts, the average power recorded from the solar panels was inaccurate. In order to get an accurate measurement, a load must be added and the amps and power measured in a circuit. A load is anything that draws power. One example of a load is a light bulb. | |
| January 5, 2016 | Researched the use of breadboard and measuring amps and volts using breadboard. Discovered Amps must be measured in series as part of circuit. Volts should be measured from outside circuit. |
|
| January 6, 2016 | Started experiment to test Average Daily Output. Measured Amps and Volts of the configurations three times today at 8am, 12pm, and 5pm. Used the following procedures to conduct trial:
During all three trials the tree configuration had the highest results. |
|
| January 7, 2016 | Continued experiment in same manner as before. Received similar results as previous day. | |
| January 8, 2016 | Experiment could not be continued due to rain throughout entire day. | |
| January 9, 2016 | Due to weather conditions, tested solar panels at 8am and 12pm only. Weather conditions were cloudy for the 8am and 12 pm trial. In the morning, the Tree had the highest results. At 12pm the Flat Roof did. | |
| January 12, 2016 | Due to weather conditions, tested solar panels at 8am and 12pm only. The tree had the best results again. | |
| January 14, 2016 | Conducted a second experiment to test the Maximum Output for three separate trials using the following procedures:
|
|
| January 16, 2016 | Repeated Maximum Output experiment at 12:00 PM as noted above using the same procedures as on January 14, 2016. | |
| January 18, 2016 | Created scatter chart in Excel from data from Maximum Output experiment to find the Maximum Output. The maximum output is identified on the chart at the location where the line elbows or bends. | |
| January 19, 2016 | Typed title page for paper. | |
| January 22, 2016 | Typed "Introduction to the Experiment" for paper. | |
| January 23, 2016 | Began typing the materials list and procedures. | |
| January 28, 2016 | Typed "Table on Contents" and "Abstract" pages for paper. Combined all typed pages into one word document. | |
| January 29, 2016 | Filled out judging sheet. Learned floor space is 13. | |
| January 31, 2016 | Purchased board and large letters for title. Positioned title on board. | |
| February 1, 2016 | Typed information about the variables and the "conclusion" page for the paper. | |
| February 2, 2016 | Made charts for Daily Output Experiment and graphs for the first trial for Maximum Output. | |
| February 3, 2016 | Continued working on "Materials" and "Procedures" pages for the paper. Made graphs for second and third trial for Maximum Experement. copied charts into "Data Analysis" page for paper. | |
| February 4, 2016 | Made finishing touches to paper. Printed and attached components to board. | |